Highlights:
- How to statistically demonstrate successful bioprocess scale up?
- Can I still use the 3 sigma approach for bioprocess scale-up qualification?
- Best practices for scale-up qualification
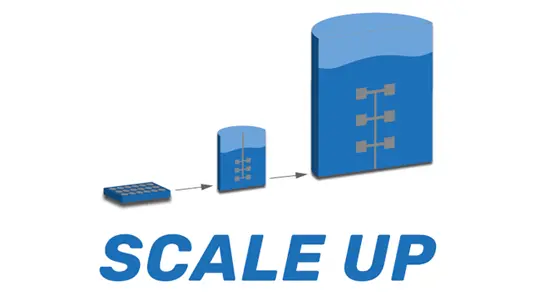
For bioprocess development and manufacturing, the question of how to demonstrate a successful bioprocess scale-up is highly debated. A new EMA paper on comparability testing now provides new insights on scientific best practices.
The EMA has recently published a draft version of a reflection paper on comparability analysis. The reflection paper focuses on statistical aspects and summarizes relevant regulatory documents and guidelines [1–3]. The focus is on comparability analysis. Hence, statistical and practical aspects on how to demonstrate that two processes or methods are similar. Methods for comparability and equivalence testing are the keys to the scientifically sound demonstration of a successful scale-up.
This article reviews the main aspects of the new EMA paper on comparability testing in their relevance to bioprocess scale-up and scale-down model qualification. For general aspects of bioprocess scale-down models, see our article on
“What is a (qualified) bioprocess scale-down model?”
Can I still use the 3 sigma approach for the demonstration of a successful scale-up?
For a long time, our industry considered 3 sigma testing to be state of the art to compare similarities. This test suggests similarity when all studied scale-down models are within 3 standard deviations of the large scale/manufacturing runs. This procedure has several drawbacks since it does not aim to identify differences in the mean of the scales, and it rewards small sample sizes, where the chance of passing the test is increased. According to our consulting experience and interactions with regulators, it is highly controversial whether the use of the 3 sigma method is appropriate to demonstrate similarity. The new EMA paper on comparability testing sheds some more light on this topic.
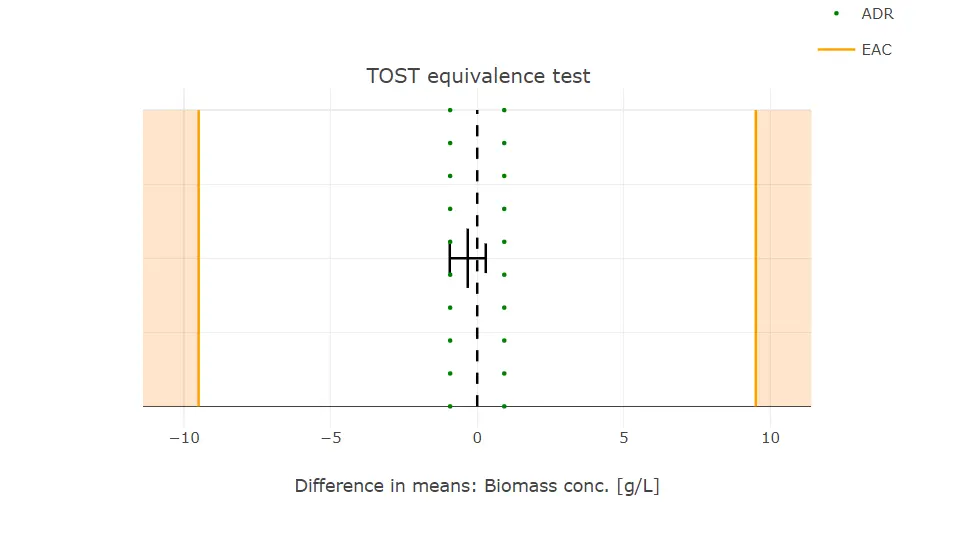
Compared to 3 sigma testing, inferential statistics (e.g. TOST testing), provide information on the risk associated with the decision-making about comparability. Therefore, it is favorable over the approach to compare a single observed value against an acceptance criterion (e.g. 3 sigma).
“Similarity criteria solely based on plans to compare single observations (e.g. of test batches) to a pre-defined acceptance range (based on reference data) are usually unsuitable to allow for reliable inference to the underlying general manufacturing process” – EMA reflection paper on comparability analysis – draft.
What shall I do if the sample size is not sufficient?
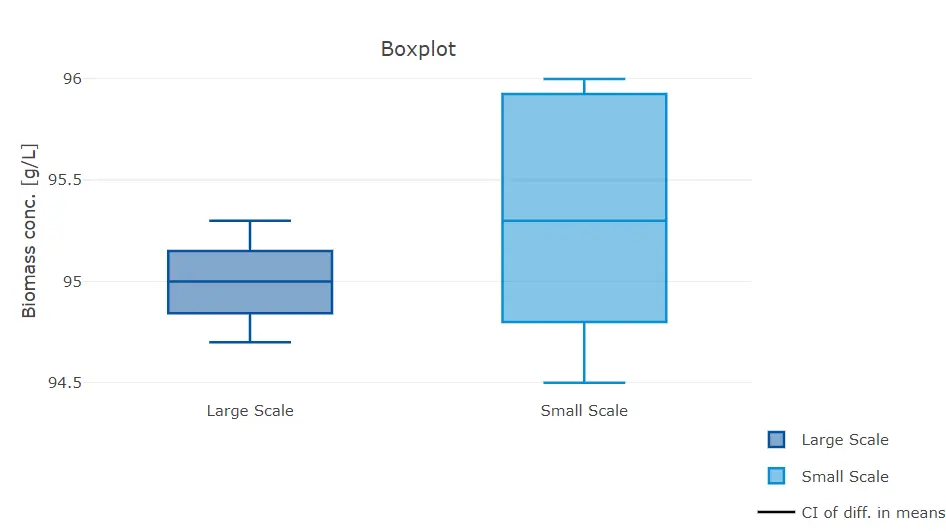
For biologics processes, we often have the case that we do not have a sufficient sample size. If this is the case, the EMA paper on comparability testing suggests using “other ways” to support similarity. The paper acknowledges the problem of low sample size but does not provide clear guidance. One possibility is the use of visualization methods in addition to inferential statistics. For more information on visualization methods, see our blog posts on bioprocess data analytics.
“…options could be explored to base the comparison of interest on more representative samples, or other ways to support similarity will have to be used.” – EMA reflection paper on comparability analysis – draft
.
What is an appropriate statistical workflow to demonstrate a successful bioprocess scale-up?
The main workflow for comparability assessment described in the reflection paper can be summarized in the following steps:
- General aim (non-inferiority or equivalence)
- Define CQAs and scale of measurement (e.g. continuous, binary)
- Measure of similarity (e.g. difference in means, ratios, multivariate measure)
- Experimental study plan and sampling strategy controlling for measurement variability
- Pre-specify acceptance criteria and check whether inferential statistical approach can be performed
- Perform equivalence/non-inferiority testing (e.g. TOST testing)
- Consideration regarding false-positive conclusion and risk mitigation of non-comparability results
Bioprocess Software with Scale Up Qualification Functionality
Bioprocess processionals use Werum PAS-X Savvy software for bioprocess data management and data analytics. Pas-X Savvy helps to analyze bioprocess scale-up along current best practices.