- Insights, stories & events
- Analytical biosimilarity
How to test regulatory compliance for analytical biosimilarity and reduce business risk and time to market?
9 min read
Biosimilars have emerged as affordable alternatives to approved biologic drugs, meeting the industry's growing demand for cost-effective treatment options. These medicines provide effective and safe therapies while reducing the financial burden on patients and healthcare systems.
"The objective of the comparative analytical assessment is to verify that each attribute, as observed in the proposed biosimilar and the reference product, has a similar population mean and similar population standard deviation.²"
FDA
U.S. Food and Drug Administration
"Applicants should therefore discuss the operating characteristics of these approaches in regulatory submissions and justify that the risk of a false positive conclusion is acceptably low.⁴"
FDA
U.S. Food and Drug Administration
Which test should we apply instead?
In response to these challenges, we have developed an innovative and recently published bootstrapping test that addresses the limitations of equivalence and range tests⁵. Our test possesses desirable properties: easy definition of similarity areas, simultaneous examination of mean and variance differences between the biosimilar and the innovator, and control of the Type I error (false positive rate) at a low and definable level (e.g., 5 percent) across the entire similarity condition.⁴
Why should I apply this new test?
Our novel bootstrapping test demonstrates up to 10 percent higher power values in the similarity region compared to existing range tests that aim to control the Type I error. Speaking in non-statistical terms: you have a 10 percent percent higher chance of passing this test if you are truly biosimilar compared to any other test out there that controls the Type I error! Alternatively, you can consider achieving the same power by saving expensive manufacturing runs required for the comparison.⁵
This superiority makes our test aligned with current regulatory requirements and positions it as an outperforming alternative to traditional quality range tests.
How does the test work?
First let’s understand what we are asked from the latest regulatory perspective⁴ to conduct a biosimilar test:
- Define a similarity condition: providing an a priori agreement on when two data distributions are to be considered as “similar”, i.e., what is the maximum allowed difference between two underlying distributions for each CQA.
- Define similarity criteria: this can be seen as the conducting the actual statistical test to check if the true difference between the two distributions is not larger than the pre-defined similarity condition.
Similarity condition
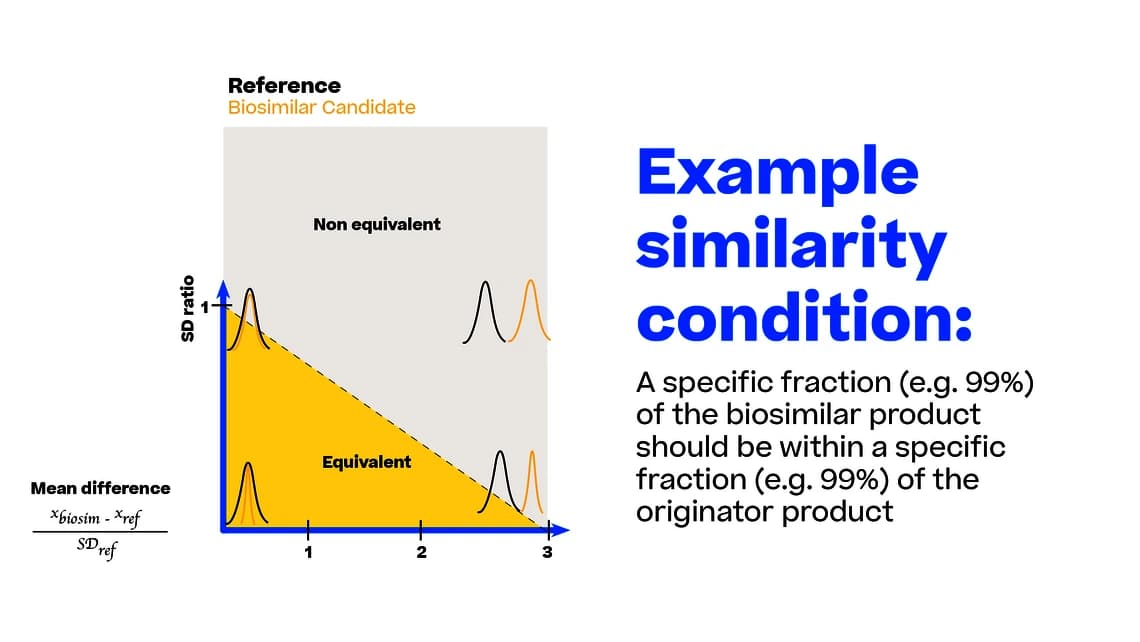
Although similarity conditions can be any a priori agreement on the difference between two distributions, let´s have a look to one of the most prominent ones illustrated in Figure 1³. Here we define similarity when 99 percent of the lots produced by the biosimilar candidate are within the range that is covered by 99 percent of the lots of the originator. Any other statement would be allowed as well and need to be in line with the Critical Quality Attributes (CQA’s) criticality, such as 90 percent of the biosimilar being within 99 percent of the originator range. These similarity conditions translate into straight lines in Figure 1.
Similarity criteria
In the following video it is showcased how the novel statistical bootstrapping test works. The only statistical prerequisite you need to know is how to calculate the mean and standard deviation of a sample.
If you are new to data science, you might also want to have a briefing on bootstrapping: Bootstrapping is a statistical resampling technique that allows you to estimate the uncertainty associated with a statistical estimator or to make inferences about a population based on a sample of data. It is particularly useful when you don't have access to a large amount of data or when the underlying distribution is unknown or non-parametric. The basic idea behind bootstrapping is to create multiple "bootstrap samples" by repeatedly sampling with replacement from the original dataset. This process involves randomly selecting observations from the original sample, allowing the same observation to be selected multiple times or not at all. By creating these bootstrap samples, you effectively simulate the process of drawing independent samples from the population. If you want to learn more about it, you will find further information here.
But now let’s have a look how this helps us to show analytical biosimilarity. Feel free to pause the video at any time:
We value your privacy.
We require your consent. This video is hosted by YouTube, a service of Google LLC (USA). When you watch the video, YouTube receives your IP address, can store cookies on your device, and link this activity to your user account. For this, you must accept YouTube cookies in the Cookie Settings. You can also select 'Accept all Cookies' and thereby consent to further cookies that allow us to make the website more user-friendly, analyze user behavior, and show you personalized advertising on other websites. You can revoke your consent at any time via the cookie settings link in our footer. Further information can be found in our Privacy Policy.
Which other tests exists?
- 3SD test: Checks if all (or a fraction) of your biosimilar data is within ±3 SD of the reference sample data.
- Min-Max test: Checks if all (or a fraction) of your biosimilar data is within the min-max range of the reference sample data.
- Equivalence test: The test performs two one sided (TOST) tests for the lower and upper range of the equivalence acceptance criteria, respectively⁶. The test checks only for difference in means of the populations.
Tests for similarity in | Tests for similarity in | Controls Type I error as | |
|---|---|---|---|
Min-Max-test | ✓ | ✓ | x |
3 SD test | ✓ | ✓ | x |
TOST equivalence test | ✓ | x | ✓ |
Bootstrapping | ✓ | ✓ | ✓ |
Table 1: Comparison of different frequently applied test for analytical biosimilarity. *in their latest reflection paper EMA requires to understand Type I error (false acceptance rate)⁴. FDA requires to investigate both, the difference in mean and variance².
Why is the novel bootstrapping test better than other existing tests?
To answer this question, we should think about what a perfect test is.
A perfect test always accepts for biosimilarity if the underlying distributions obey the similarity condition (100 percent acceptance rate) and never accepts for biosimilarity if they do not obey the similarity condition (0 percent acceptance rate), see Figure 2.
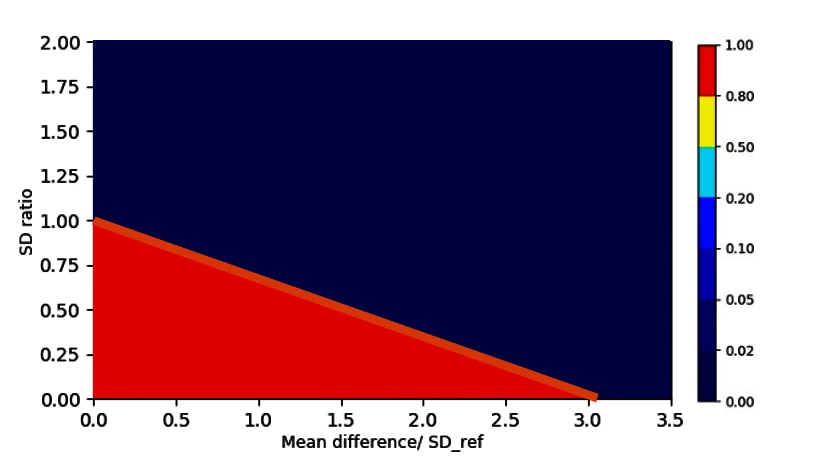
For comparing the “imperfectness” of different tests to this ideal state, we can generate sample data with a given sample size (e.g., 20 lots for each biosimilar and reference) from any point of this coordinate system. Remember each point in this coordinate system translates into an exact definition of the biosimilar and reference population (mean and SD).
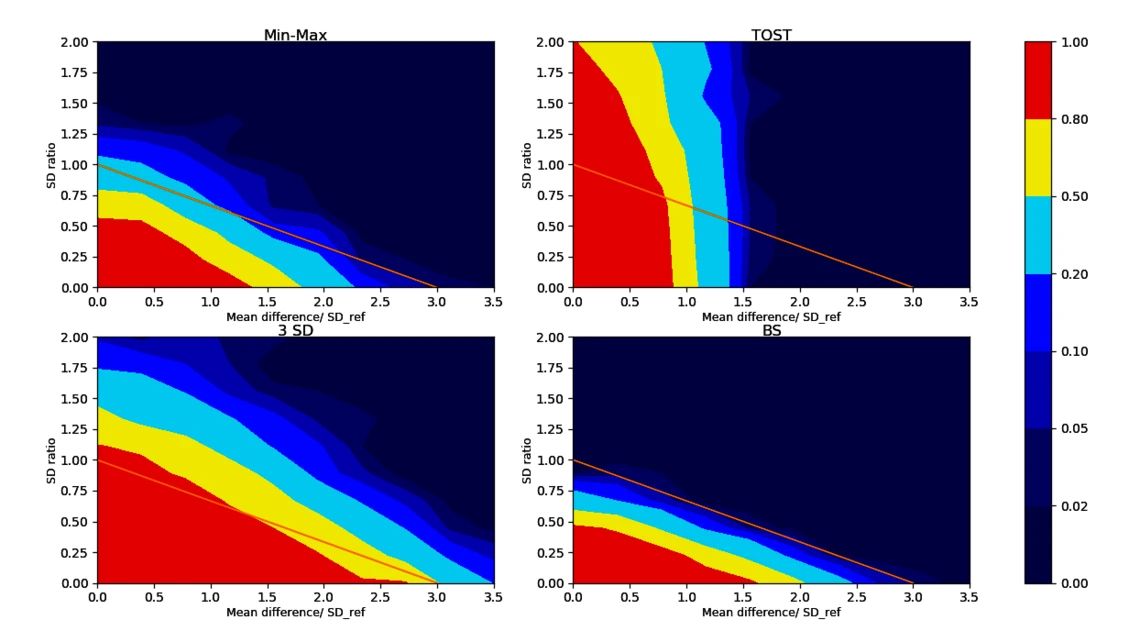
For each test listed above we can count how often the test accurately accepts/rejects biosimilarity. For typical sample sizes (such as 20 lots of each biosimilar and reference product lot) we see the acceptance rate for biosimilarity plotted over different scenarios for different tests in Figure 3.
Let’s compare the bootstrapping test to the frequently applied 3 SD test: As we see in the lower left corner of Figure 3, the 3 SD test accepts for biosimilarity in large areas of the non-equivalence regions as indicated by the large red and yellow fraction outside the similarity condition. This leads to a high regulatory risk of falsely accepting biosimilar candidates that are truly not biosimilar. Moreover, this test is flawed as it becomes easier to pass as the sample size of biosimilar data decreases³ ⁴ ⁷. The same situation is true for the min-max test (top left of Figure 3).
As shown in the upper right corner of Figure 3, the TOST equivalence test only checks for the difference in means (x-axis) but also incorrectly accepts for biosimilarity (red areas) when the SD of the biosimilar population is way larger than the SD of the reference (large y-values in our coordinate system).
For an even more thorough comparison to other tests please refer to the peer-reviewed publication⁵.
Conclusion
- By adopting our bootstrapping test, you can confidently establish the analytical similarity of your biosimilar product and hence safe costly clinical trials.
- It offers a robust and comprehensive approach that meets the demands of regulators and helps ensure a successful licensing process.
- It even increases your chances of being accepted as a biosimilar by 10 percent or saves an equivalent number of runs compared to other tests that control the Type I error. Hence, this test reduces your business risk, required resources and time to market significantly.
Feel free to reach out to us and get a meeting with our data science experts!
Our sources
Get to know our authors

Thomas Zahel
Head of CMC Innovation Consulting
Thomas Zahel is Head of CMC Innovation Consulting at Körber. He holds a master’s degree in Biochemical Engineering from the Technical University of Graz and a PhD in applied statistics from Vienna Technical University. He has expert knowledge in theory and implementation of a multitude of statistical disciplines and long experience in developing statistical workflows for process characterization.
You may also be interested in: