- Insights, stories & events
- Data science for biotech products
Leverage data science for your biotech product life cycle
3 min read
Up to 80% of highly skilled data scientists' time is being spent on data alignment, cleansing, contextualization as well as creating test data sets. However, the real value lies not in the raw data itself, but in its interpretation. Here's how PAS-X Savvy can support you.
1. Data interfacing > 2. Data contextualization > 3. Data analysis > 4. Data sharing & reporting
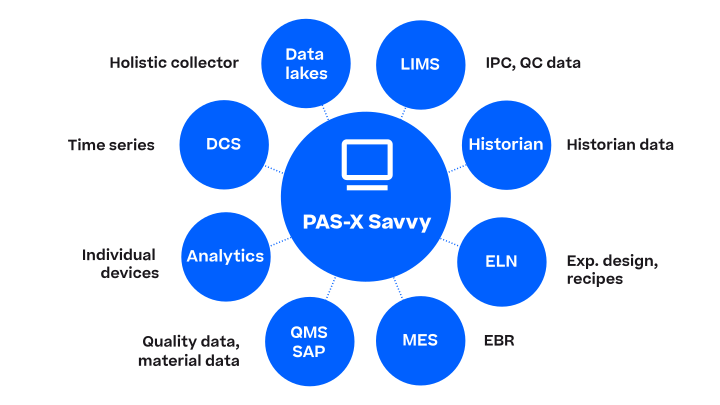
PAS-X Savvy can collect data from all of the above listed sources automatically, saving you time and effort in the first step of the data journey.
The result: Data of all formats are centrally available.
1. Data interfacing > 2. Data contextualization > 3. Data analysis > 4. Data sharing & reporting
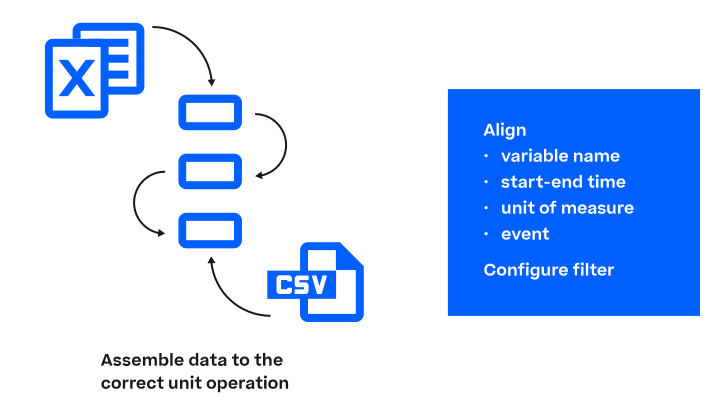
PAS-X Savvy not only gets the right data to the right process, but also aligns, harmonizes and structures it. This contextualization process is a crucial step before any analytical work can begin.
The result: Structured data can be clearly visualized.
1. Data interfacing > 2. Data contextualization > 3. Data analysis > 4. Data sharing & reporting
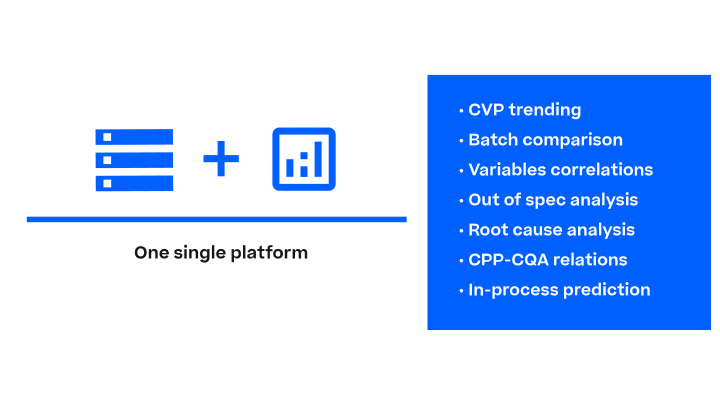
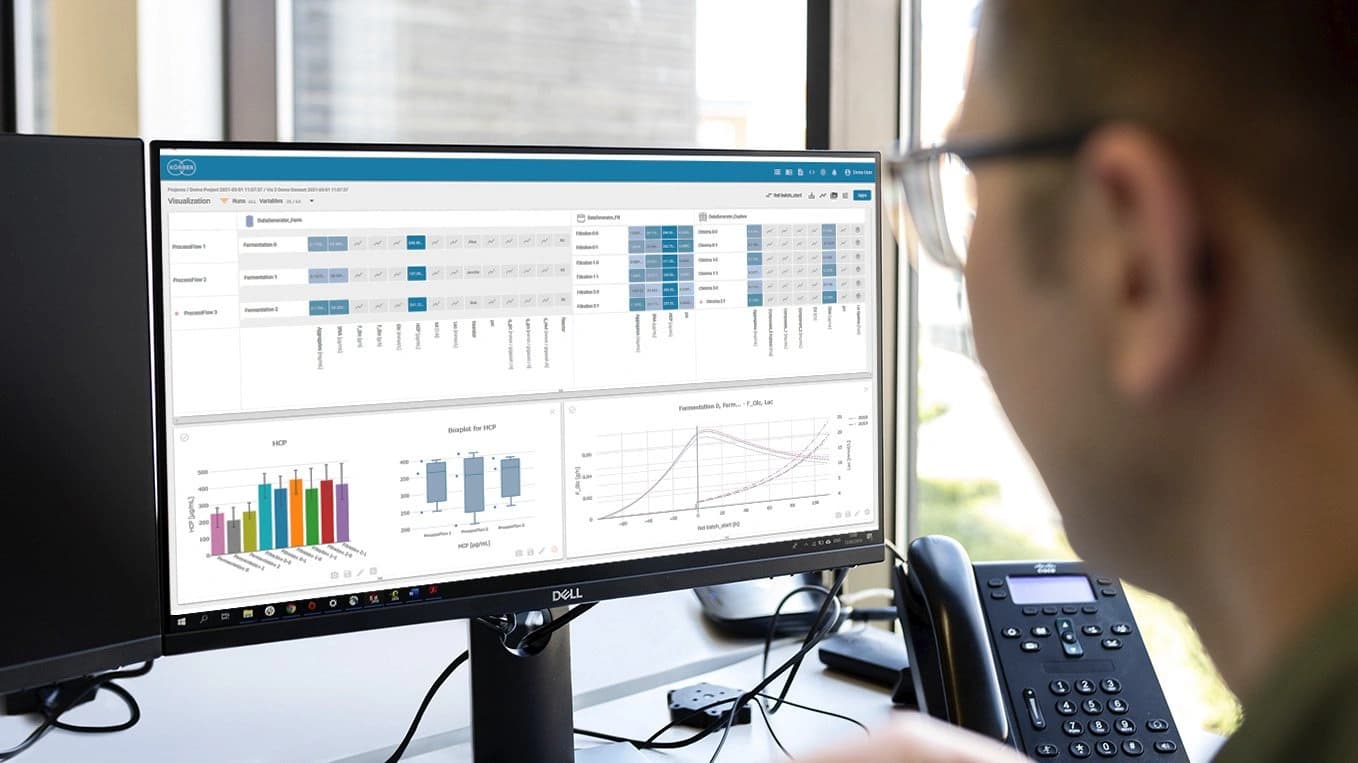
PAS-X Savvy offers an integrated data analysis platform so that the contextualized data does not have to be exported for data analysis. This means you have a seamless data evaluation result right after data is available.
The result: The data analysis results are instantly available.
1. Data interfacing > 2. Data contextualization > 3. Data analysis > 4. Data sharing & reporting
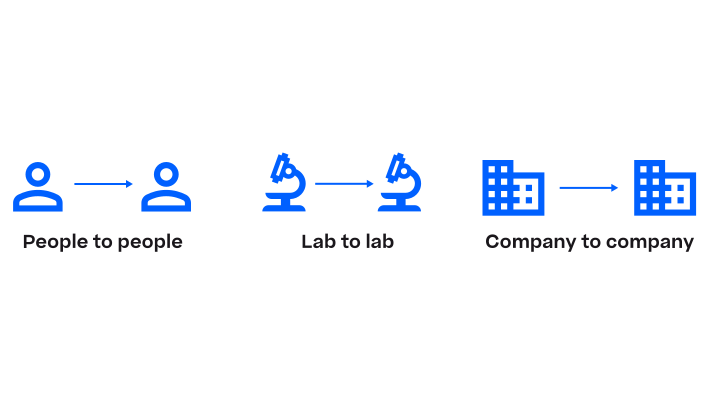
PAS-X Savvy allows you to share plots and analysis results with colleagues, other labs and companies with just a few clicks and to generate Word reports based on predefined templates including tables, plots and text elements.
The result: It becomes quick and easy to generate and share reports with others.
PAS-X Savvy – accelerate your data journey
We believe that data has a pivotal role to play in the biotech product life cycle. With development cycles and time-to-market getting shorter, the collection, preprocessing, visualization and analysis of big data without much human intervention will become essential in the biotech industry. PAS-X Savvy offers you an all-in-one solution to address these challenges. Get in touch with us for more information or a free demo!
Accelerate your process data analytics
Explore how Werum PAS-X Savvy revolutionizes managing, analyzing and reporting of your pharma and biotech process data.
You may also be interested in: