- Insights, stories & events
- Biosimilarity and bioequivalence
Biosimilarity: How to statistically demonstrate bioequivalence for biosimilars?
5 min read
Explore how statistical and multivariate approaches help demonstrate biosimilarity in biosimilar development, following EMA guidelines and best practices.

As a biotech company or quality laboratory involved in the development or manufacture of biosimilars, you are responsible for demonstrating the bioequivalence/ biosimilarity of your biosimilars to originator products. In particular, at early stages (strain screening, early phase development), the demonstration of bioequivalence/ biosimilarity is an important but highly debated topic. A new EMA paper on comparability testing now provides new insights on current best practices. This article reviews the main aspects of the new EMA paper on comparability testing and regulatory documents and guidelines [1–3] in their relevance to bioequivalence testing.
What is an appropriate statistical workflow to demonstrate bioequivalence / biosimilarity?
Here we summarize the main aspects. The authors of the reflection paper came up with a workflow that can be summarized in the following steps:
- Define general aim
(non-inferiority or equivalence) - Define CQAs
(e.g. continuous, binary) - Define measure of similarity
(e.g. difference in means, ratios, multivariate measure) - Conduct experimental study plan and sampling strategy controlling for measurement variability
- Pre-specify acceptance criteria and check whether the inferential statistical approach can be performed
- Perform equivalence/non-inferiority testing
(e.g. TOST testing) - Consideration regarding false-positive conclusion and risk mitigation of non-comparability results
How should I proceed during biosimilar screening to detect biosimilarity?
As a biosimilar developer, you first have to screen for a production clone that produces a product similar to the originator. Typically, you measure multiple critical quality attributes of the product. To be cost-efficient, you typically compare the analytical results of one strain to the originator population. It is highly challenging to perform inferential statistics in this situation since you have only one measurement of the clone and need to conclude for that. This follows the EMA reflection paper, which states that inferential statistics is not always feasible, especially when comparing single values to a population.
Especially for biosimilar screenings, multiple CQAs are measured, which are correlated with each other. Hence, it is good to use multivariate methods that have increased power to detect similarities and potential differences.
Multivariate Biosimilarity Analysis for Biosimilar Screening
Quality professionals use Werum PAS-X Savvy software for biologics quality data management and data analytics. For the case of biosimilar screening, Körber, together with Vela Laboratories, has developed a powerful approach to demonstrate multivariate similarities of individually tested clones/process conditions. It works in the following way:
- Selection of the originator group: clones/process conditions to be compared & variables that will be used to assess similarity
- As a result, candidate biosimilar clones/process conditions can be categorized into:
- Similar to certain confidence (all biosimilar batches in the green area of the example below)
- Similar, but showing a different correlation between analytical methods, such as biosimilar batches 4 and 5 in the example below (e.g. those might be caused by inconsistency between the result of redundant methods)
- Showing extreme/different behavior than the originator, such as biosimilar batch 7 in the example below - Variables are identified by the app that leads to inconsistent or extreme behavior of biosimilar batches. At this point, counteraction can be taken either by re-measuring a sample or stating clones/process conditions as similar or different. As a consequence, the most similar clones/process conditions can be identified.
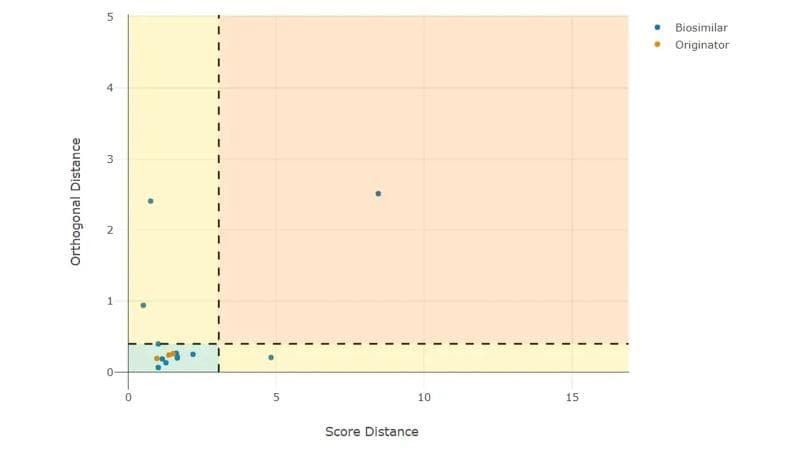
Outlier plot showing biosimilar and originator batches with their associated multivariate scores and orthogonal distances. Additionally, also the 97.5% tolerance intervals are indicated as black dashed lines. Score distance of samples acts as a measure for biosimilarity to the originator group. Batches in the green area can be considered similar to the originator.
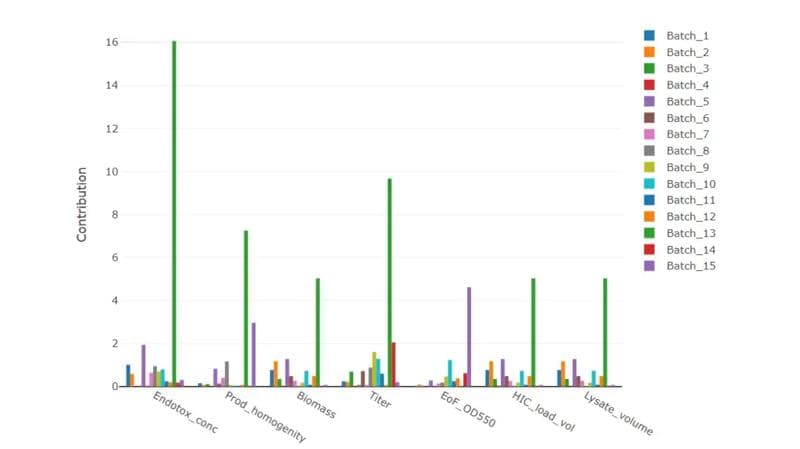
Contribution plots show which variables contribute most to the difference of the biosimilar to the originator group. Especially batch 13 shows differences in endotoxin concentration (Endotox_conc) and Titer.
The solution is available as a plug-in for PAS-X Savvy data management and analytics software. For more information, contact us and talk to one of our data scientists.

PAS-X Savvy for GMP Quality labs: Bioequivalence Testing
As a leading analytical service provider and biotech laboratory in the field of Biosimilars, we support many customer projects involving biosimilar clone screening as well as comparability studies. Our clients need to select the right clones with minimal analytical effort and highly consistent data. With PAS-X Savvy® software, we now have a tool in hand to explore which clones or process conditions perform most similarly to the originator product. Furthermore, we can explore which process parameters and settings achieve the highest biosimilarity score.
Get to know our authors

Thomas Zahel
Head of CMC Innovation Consulting
Thomas Zahel is Head of CMC Innovation Consulting at Körber. He holds a master’s degree in Biochemical Engineering from the Technical University of Graz and a PhD in applied statistics from Vienna Technical University. He has expert knowledge in theory and implementation of a multitude of statistical disciplines and long experience in developing statistical workflows for process characterization.
You may also be interested in: